Poops & Foods
poopsandfoods.com
In development

Keep track of what you eat, and what comes of it.

An app to track your poops and the foods that, quite literally, created them. Look for trends. Make connections. Try new things. Improve your poop life.

Get it on Google Play
Coming soon
Not on the Store yet — Android first, free to start.
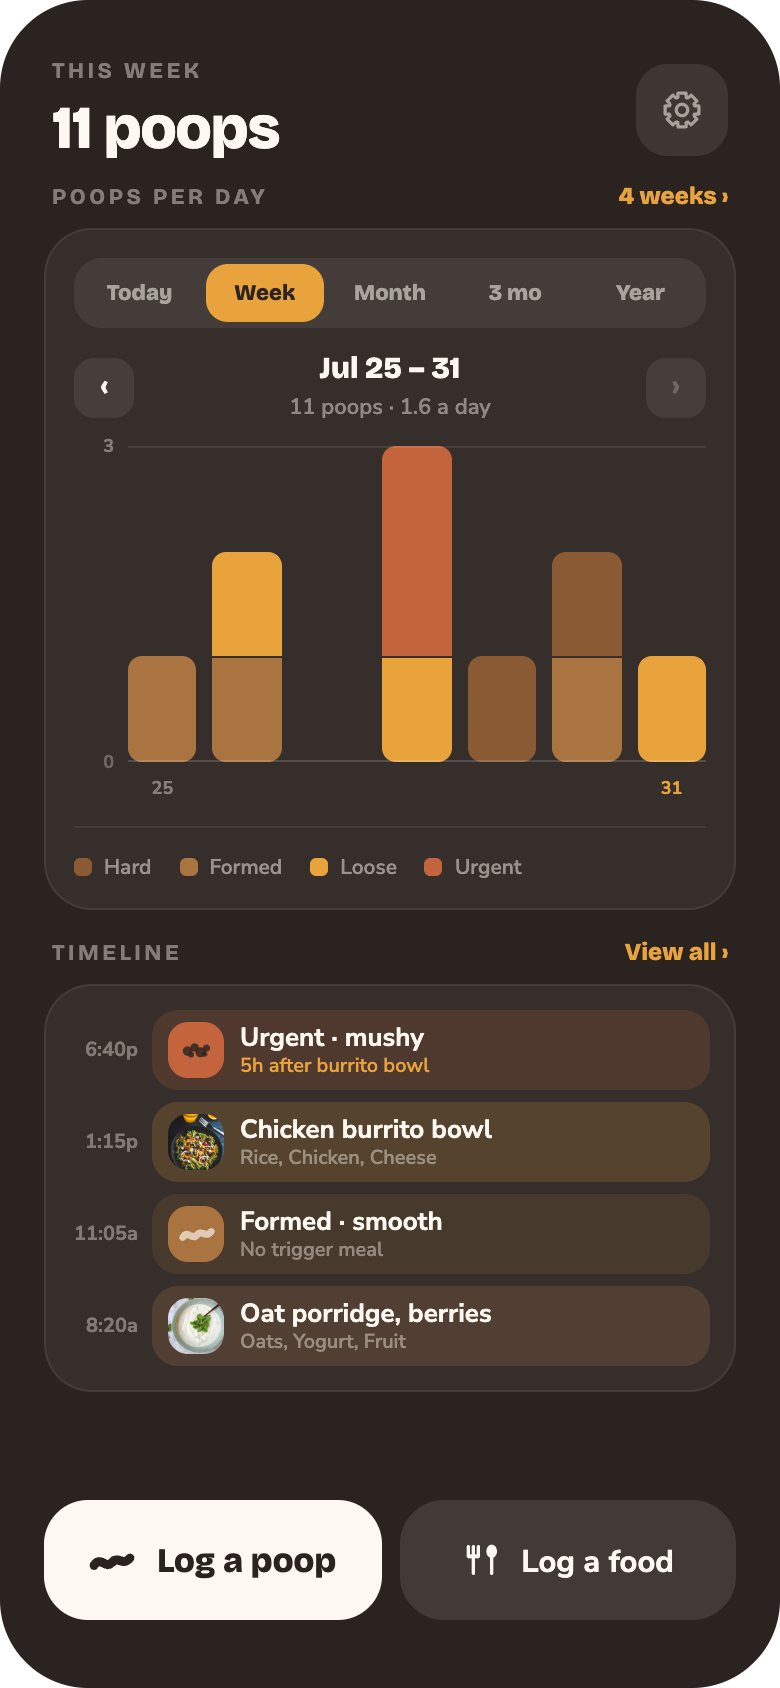
Poops and Foods home screen: this week's count, a poops-per-day chart, a timeline of recent meals and poops, and two logging buttons.

How it works

01
Log stuff in seconds

Two buttons on the home screen: log a poop, or log a food. Fill in the details — a type off the Bristol scale, or the foods that were in the meal — and it’s logged.

02
Watch the days take shape

Meals and poops pile up as you go, and the app keeps them in order. Look at a single day, a week, or twelve weeks at once.

03
Go exploring

Every food and every poop gets compared, with math, against your own normal. Dairy days followed by twice as many poops. Big meals that leave you uncomfortable. A place that has never once agreed with you.

Logging it

Log a poop

Four screens, and only the first is required.
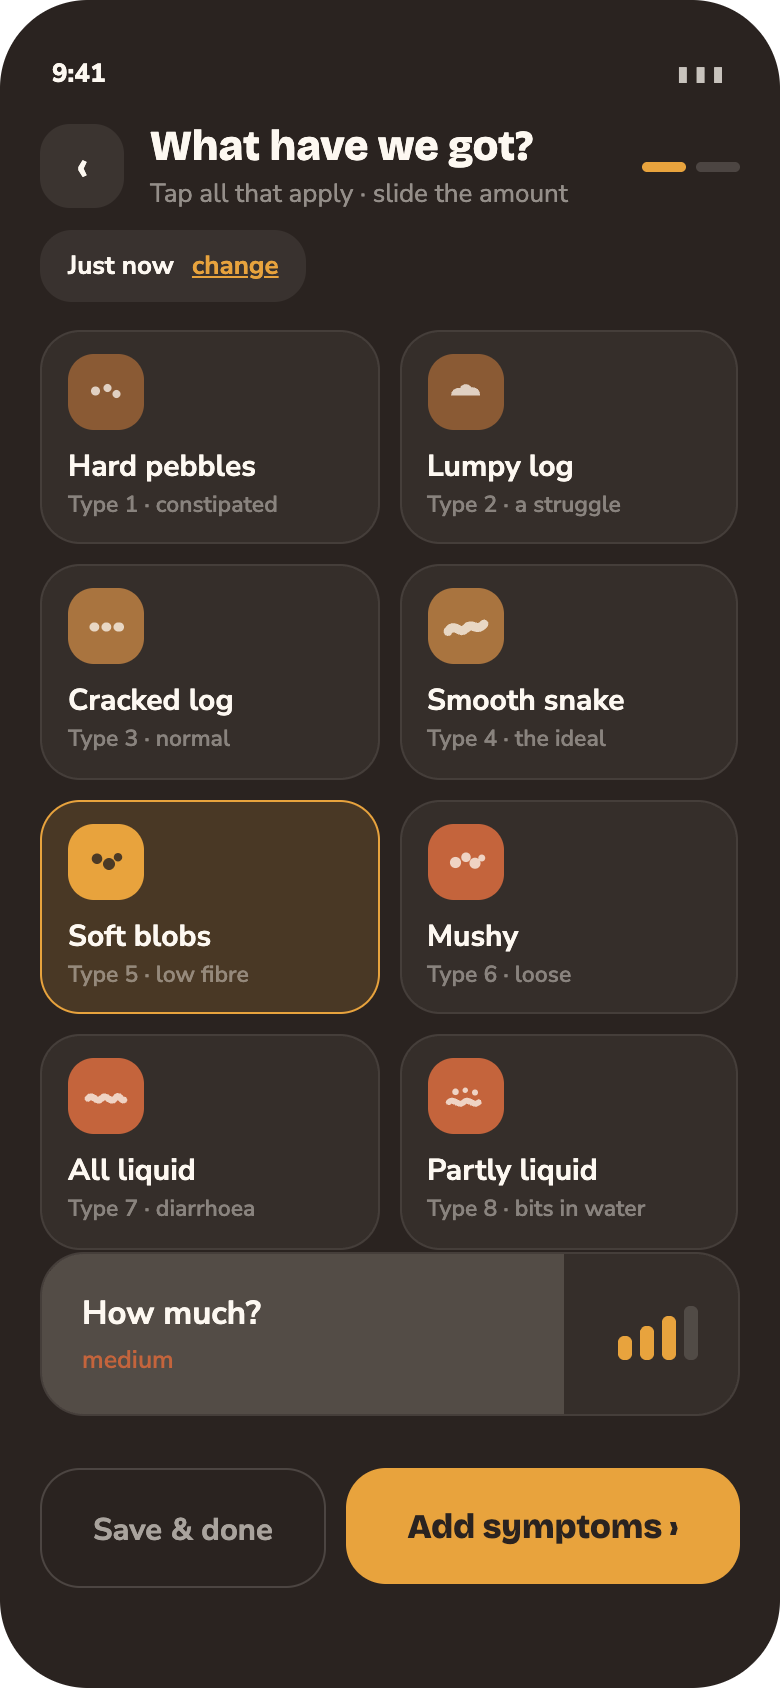
Step 1 of 4
What have we got?

Tap the type off the Bristol scale, more than one if it was mixed, and slide the amount.

What have we got? Tap the type off the Bristol scale, more than one if it was mixed, and slide the amount.
Step 2 of 4
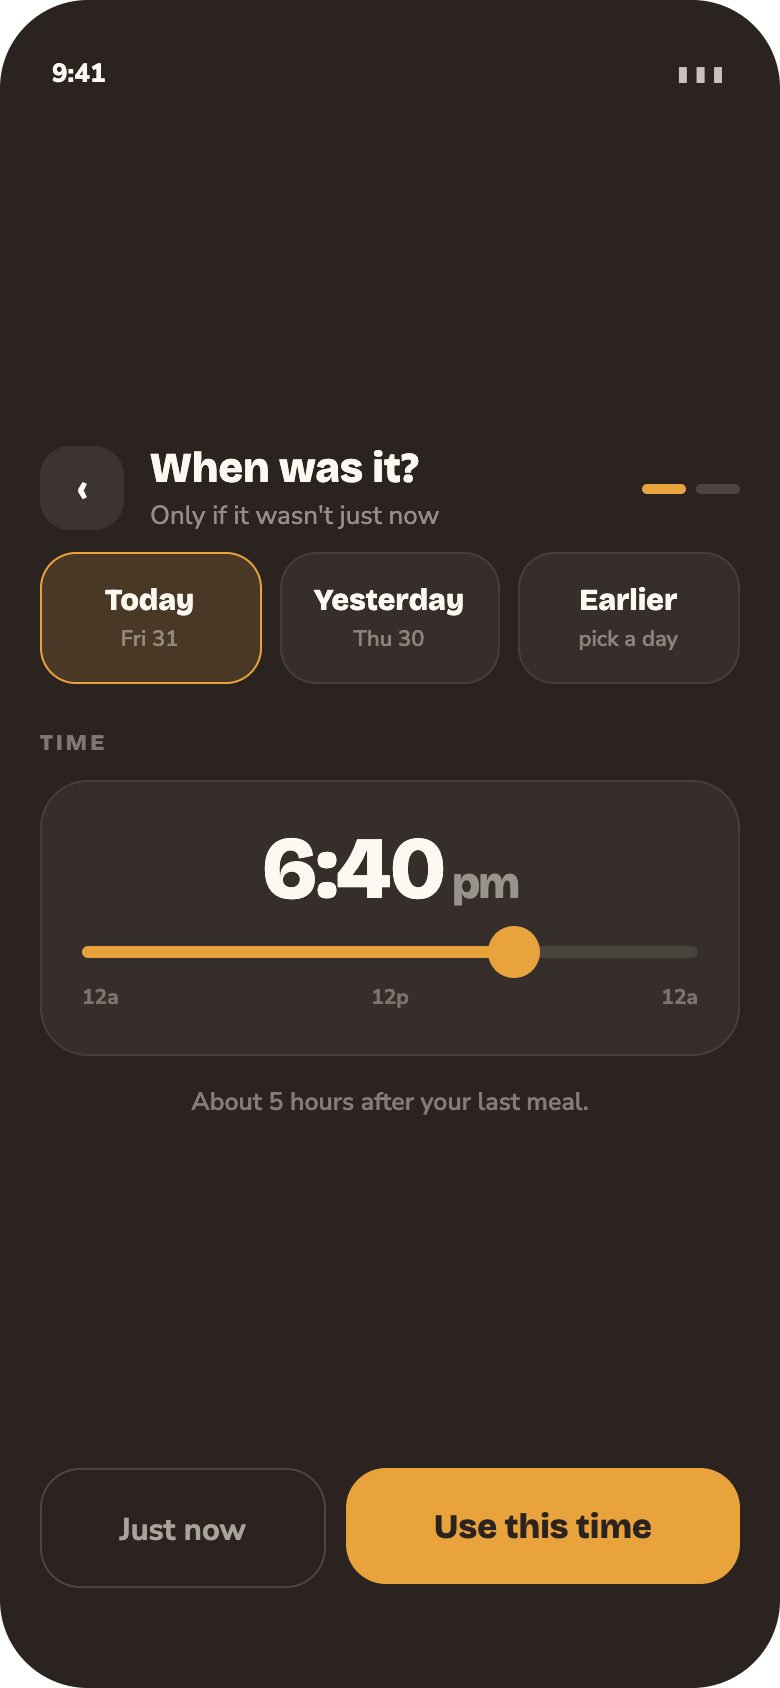
When was it?

Only if it wasn't just now. The time chip back-dates it.

When was it? Only if it wasn't just now. The time chip back-dates it.
Step 3 of 4
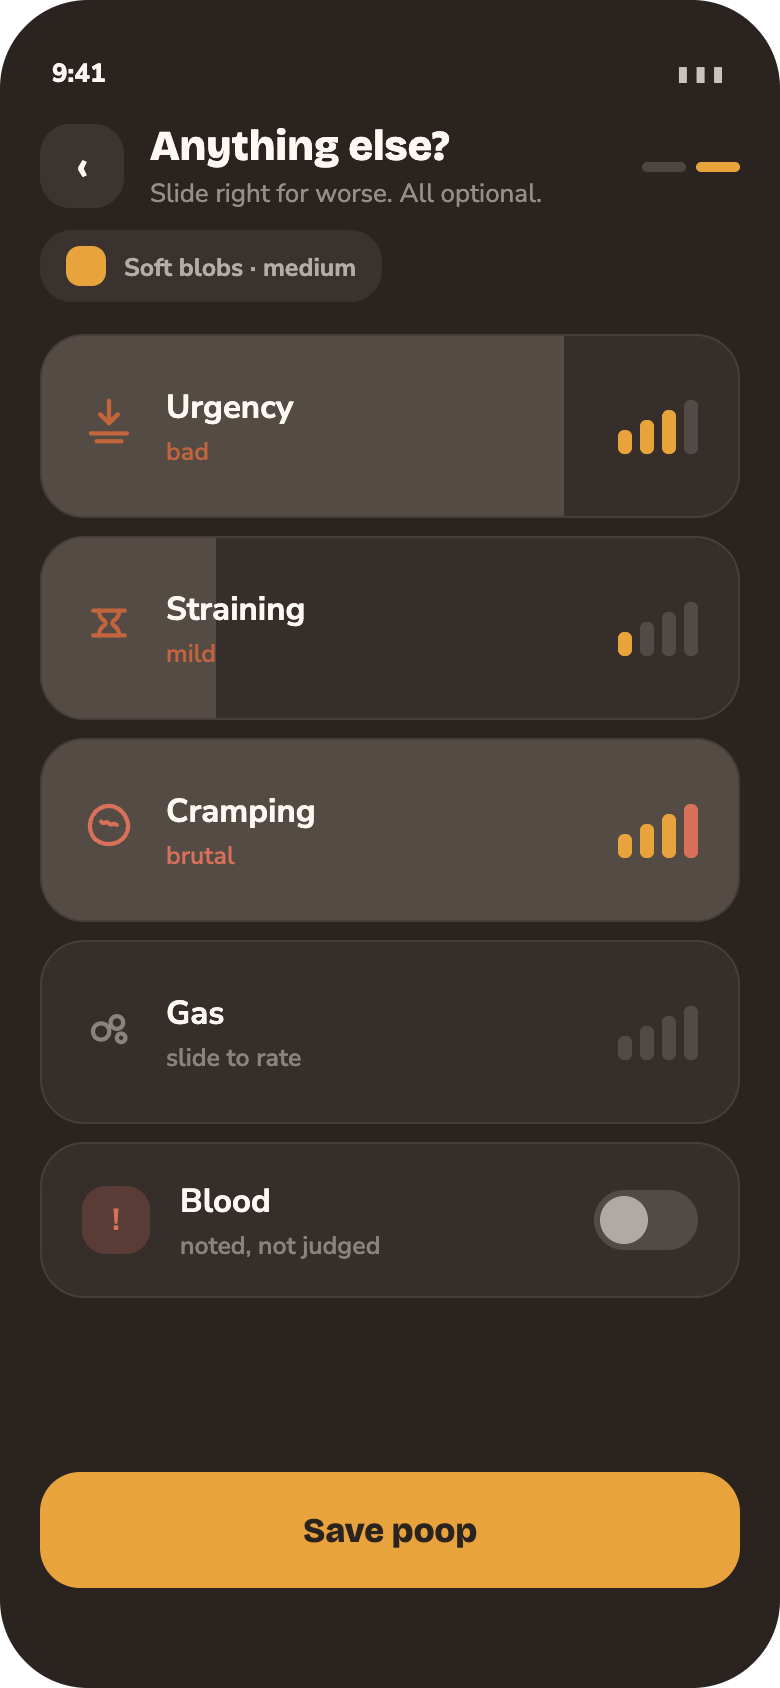
Anything else?

Four symptom sliders, all optional. Slide right for worse.

Anything else? Four symptom sliders, all optional. Slide right for worse.
Step 4 of 4
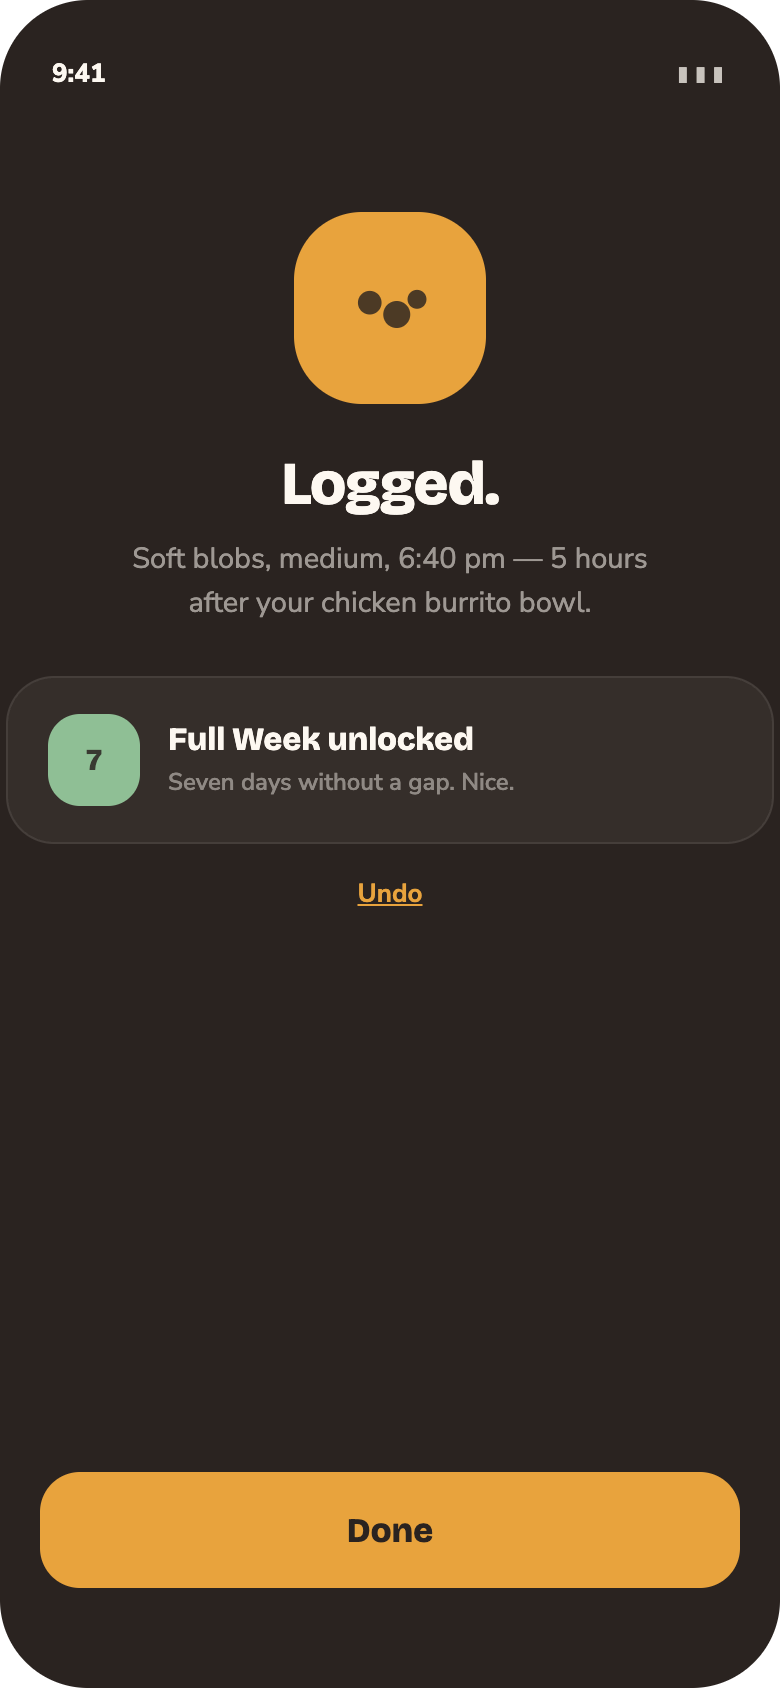
Saved

Four taps, done, and undo sits in the toast.

Saved. Four taps, done, and undo sits in the toast.
Log a food

Two screens. The meal name does the work of a timestamp.
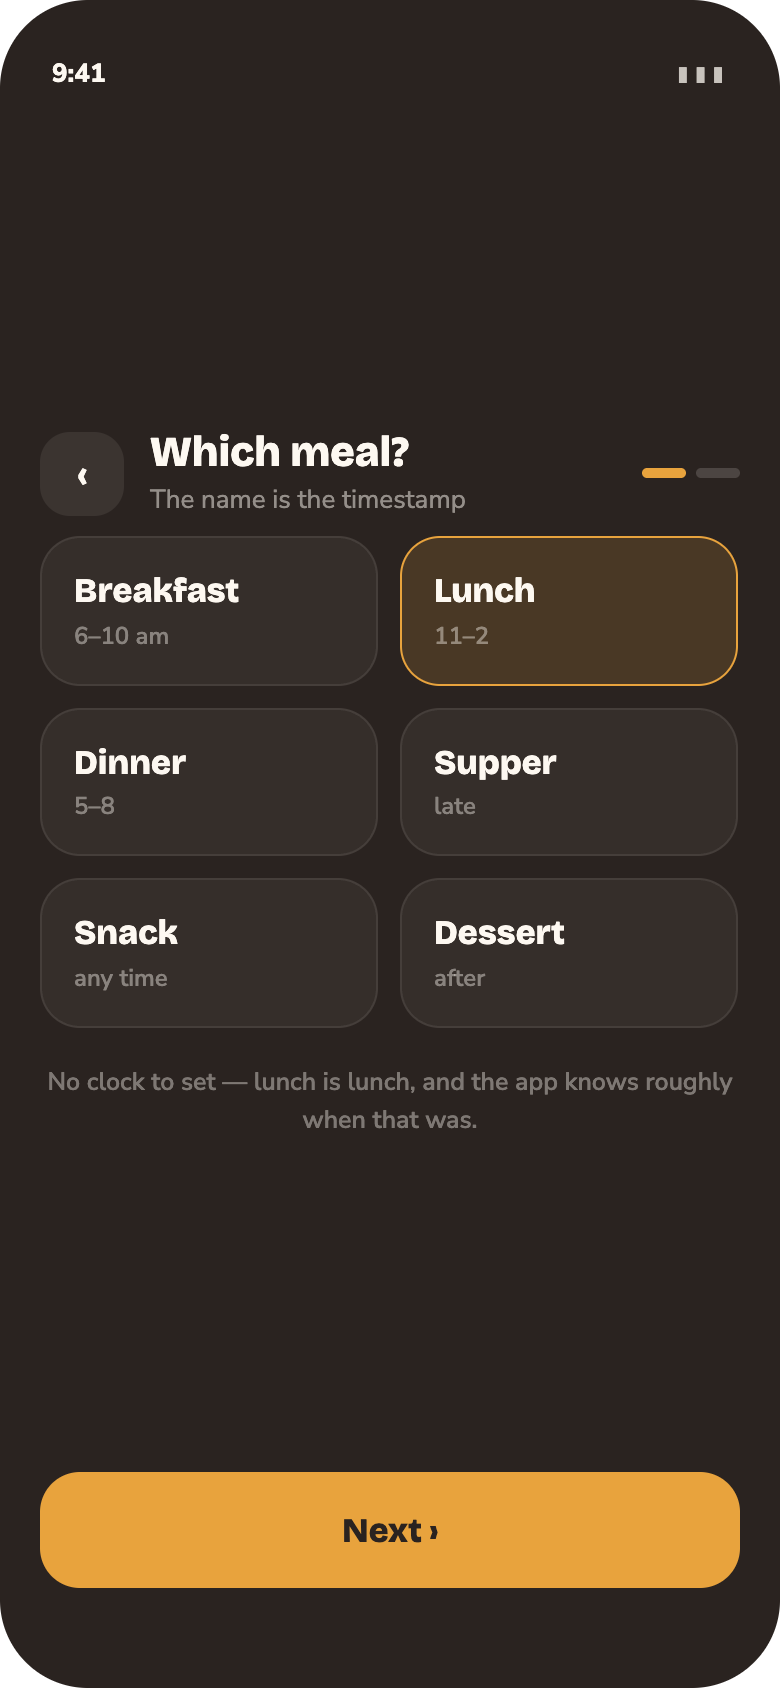
Step 1 of 2
Which meal?

The meal name is the timestamp. No clock to set.

Which meal? The meal name is the timestamp. No clock to set.
Step 2 of 2
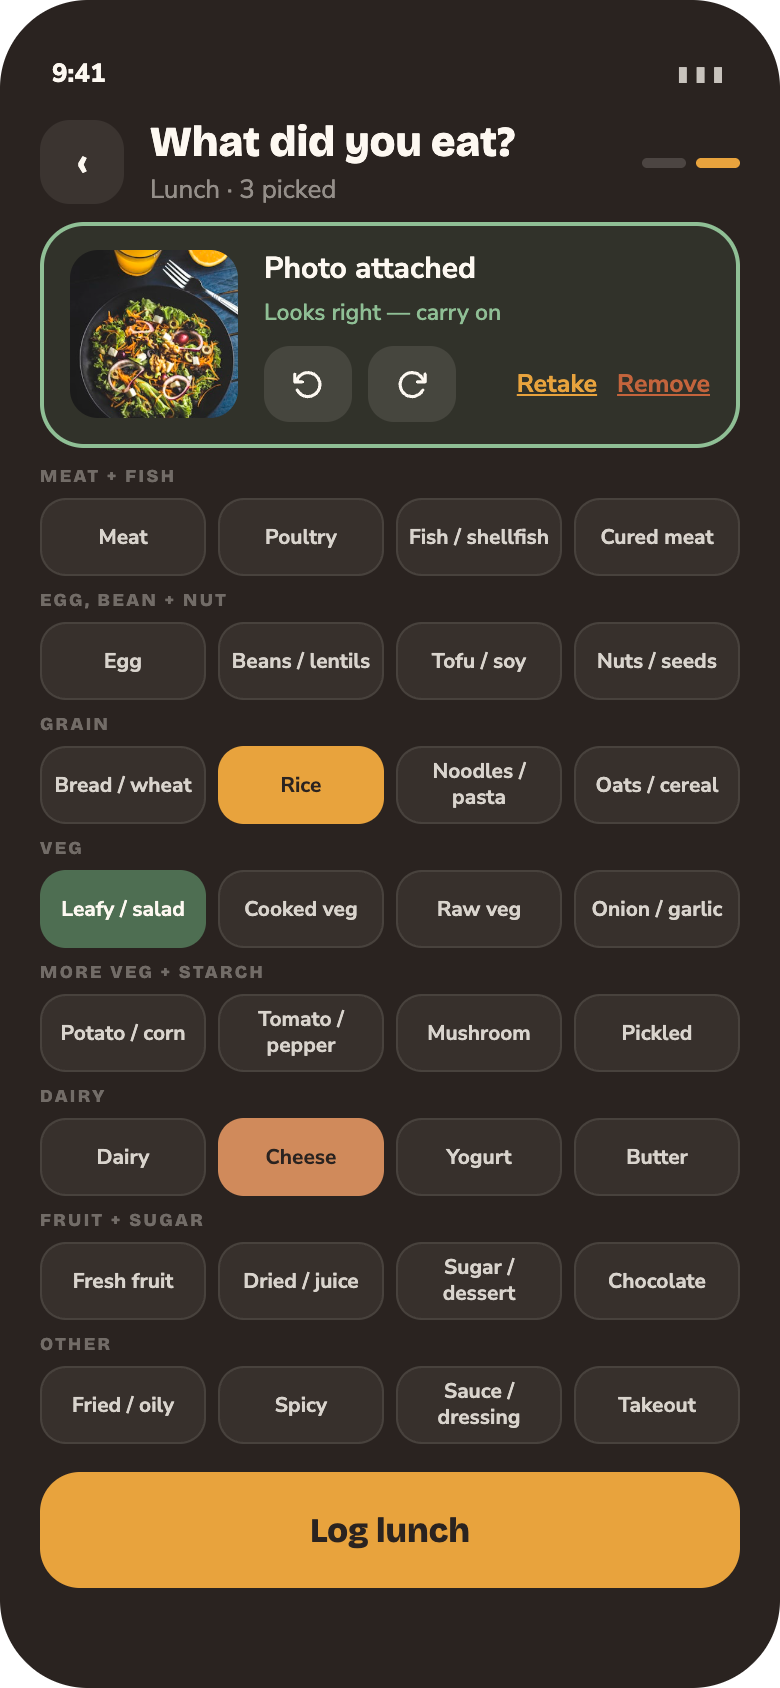
What did you eat?

Tap the foods. Attach a photo and you'll remember the details later.

What did you eat? Tap the foods. Attach a photo and you'll remember the details later.

Counting it

A bunch of ways to view the data.

This part of the app shows you some raw numbers, just to help you keep track of what’s going on.
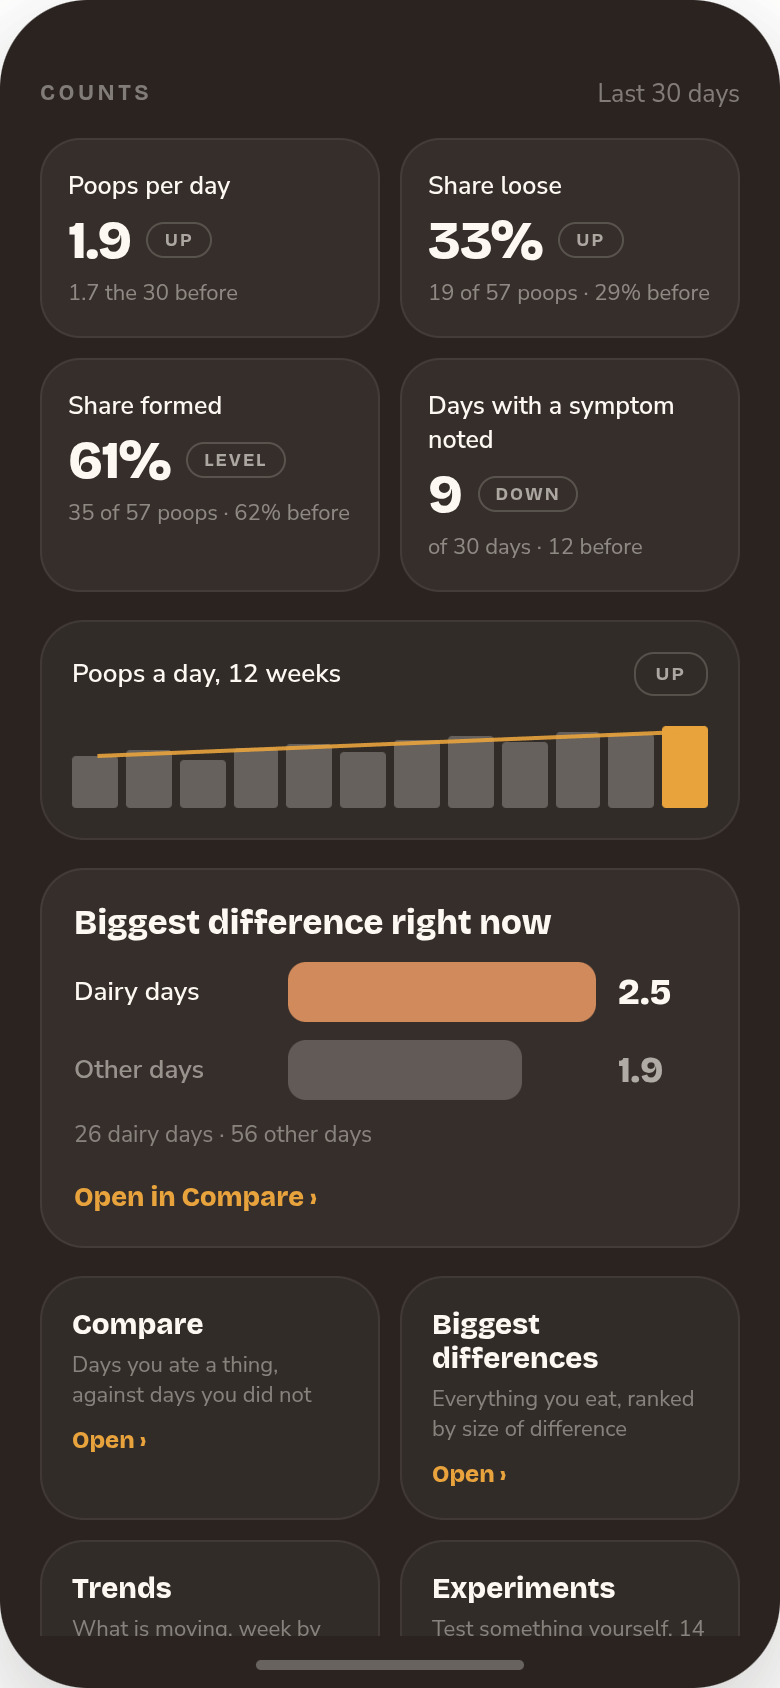
The Counts section at the foot of Patterns: four figures for the last thirty days, a twelve-week sparkline, the biggest difference right now, and links to Compare, Biggest differences, Trends and Experiments.
Take a quick look at your trends and how things are going.

At the bottom of the Patterns screen you get a quick read on your last thirty days: how many poops a day, how many were loose, how many were formed, and how many days you noted a symptom. Each one is shown next to the same number for the thirty days before, so you can see whether things are moving. Under that, a chart of the last twelve weeks and the one food that is making the biggest difference right now.

Every number comes with the days it was counted from, like “26 dairy days against 56 other days”, so you can always see how much is behind it. Nothing here calls a day good or bad. It just counts.

01

Compare

Pick a cuisine, a food, a way of cooking or a place you ate. Two bars: the days you ate it, and the days you did not, plus the sorts of poops those days brought and the hours they landed in.
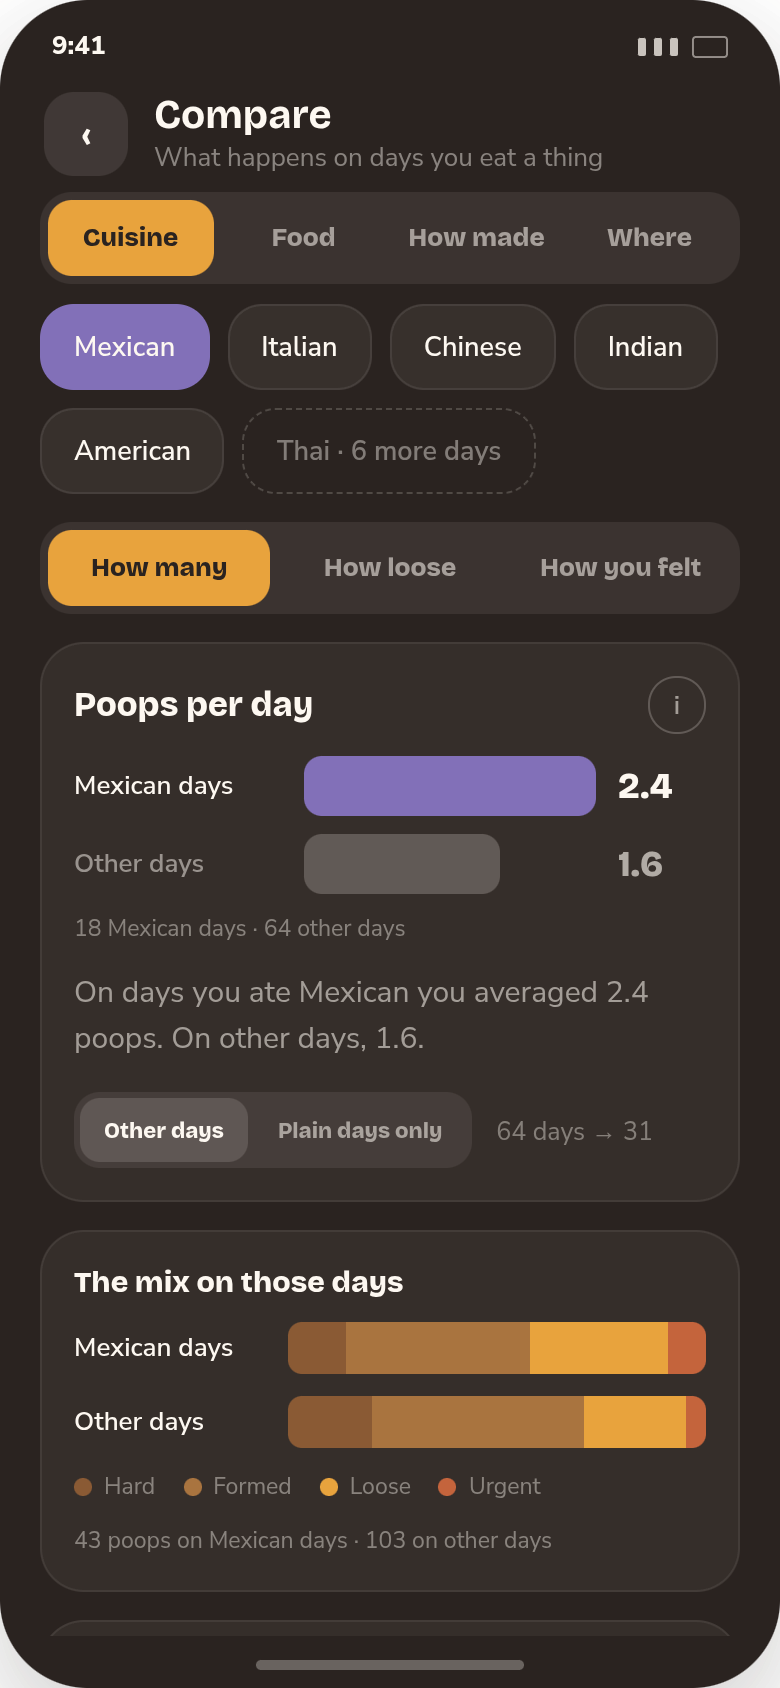
Compare screen: Cuisine selected, Mexican days at 2.4 poops a day against 1.6 on other days, the Bristol mix on each arm, and the hours those poops landed in.
02

Biggest differences

Everything you eat, ranked by how far it moves you from a normal day for you. Anything you have not eaten enough of yet waits underneath, with how many more days it needs.
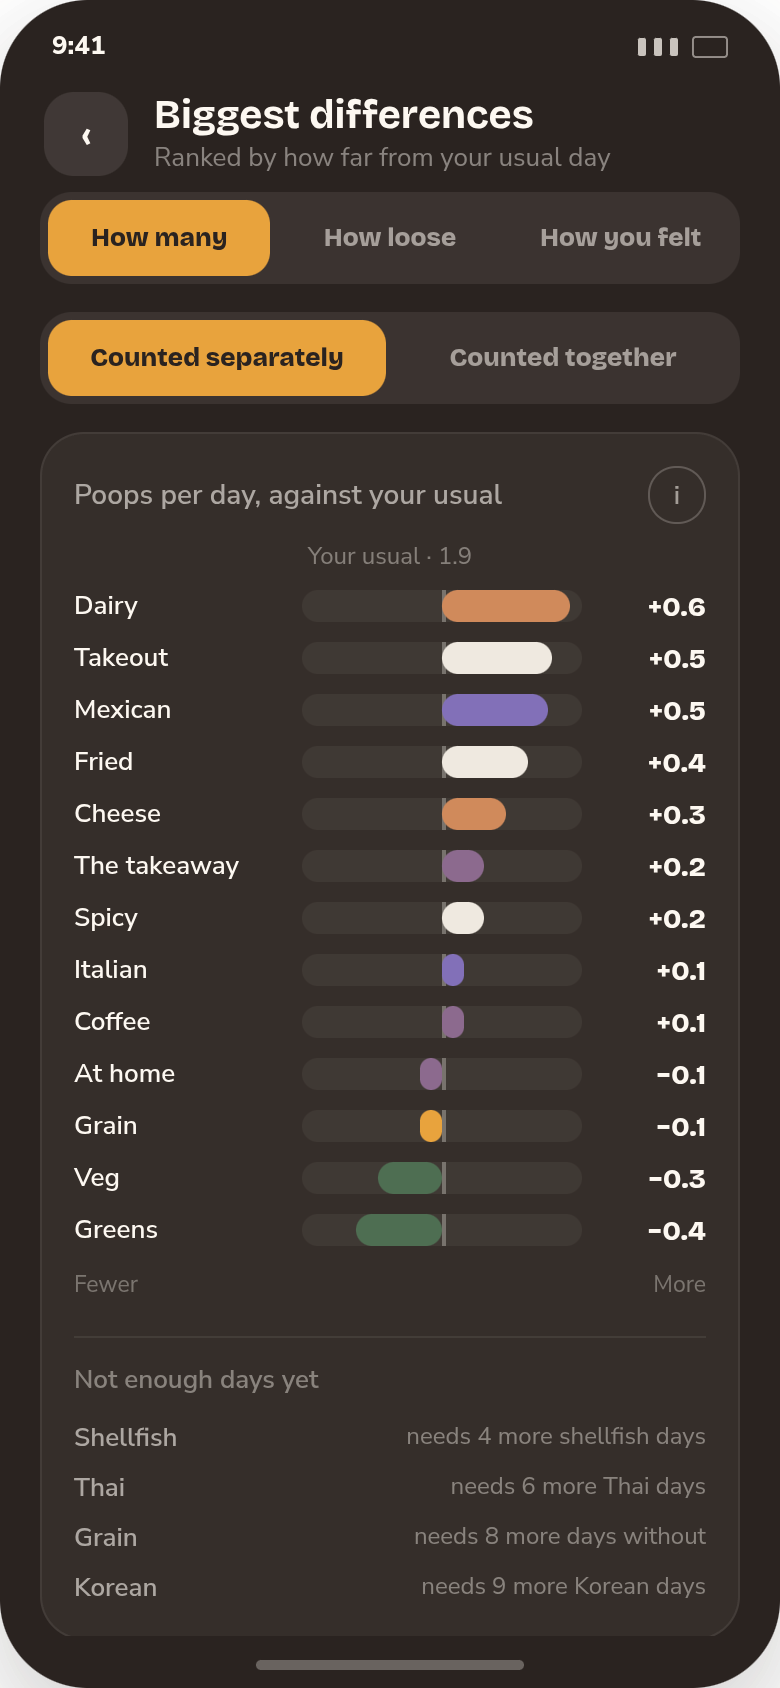
Biggest differences screen: every subject ranked either side of your usual day, from Dairy at plus 0.6 to Greens at minus 0.4, with the too-thin subjects listed underneath.
03

Trends

Two weeks to twelve, with a line through the bars and one word for which way it is going: up, down, or level. Below that, which sorts of foods and meals filled each week.
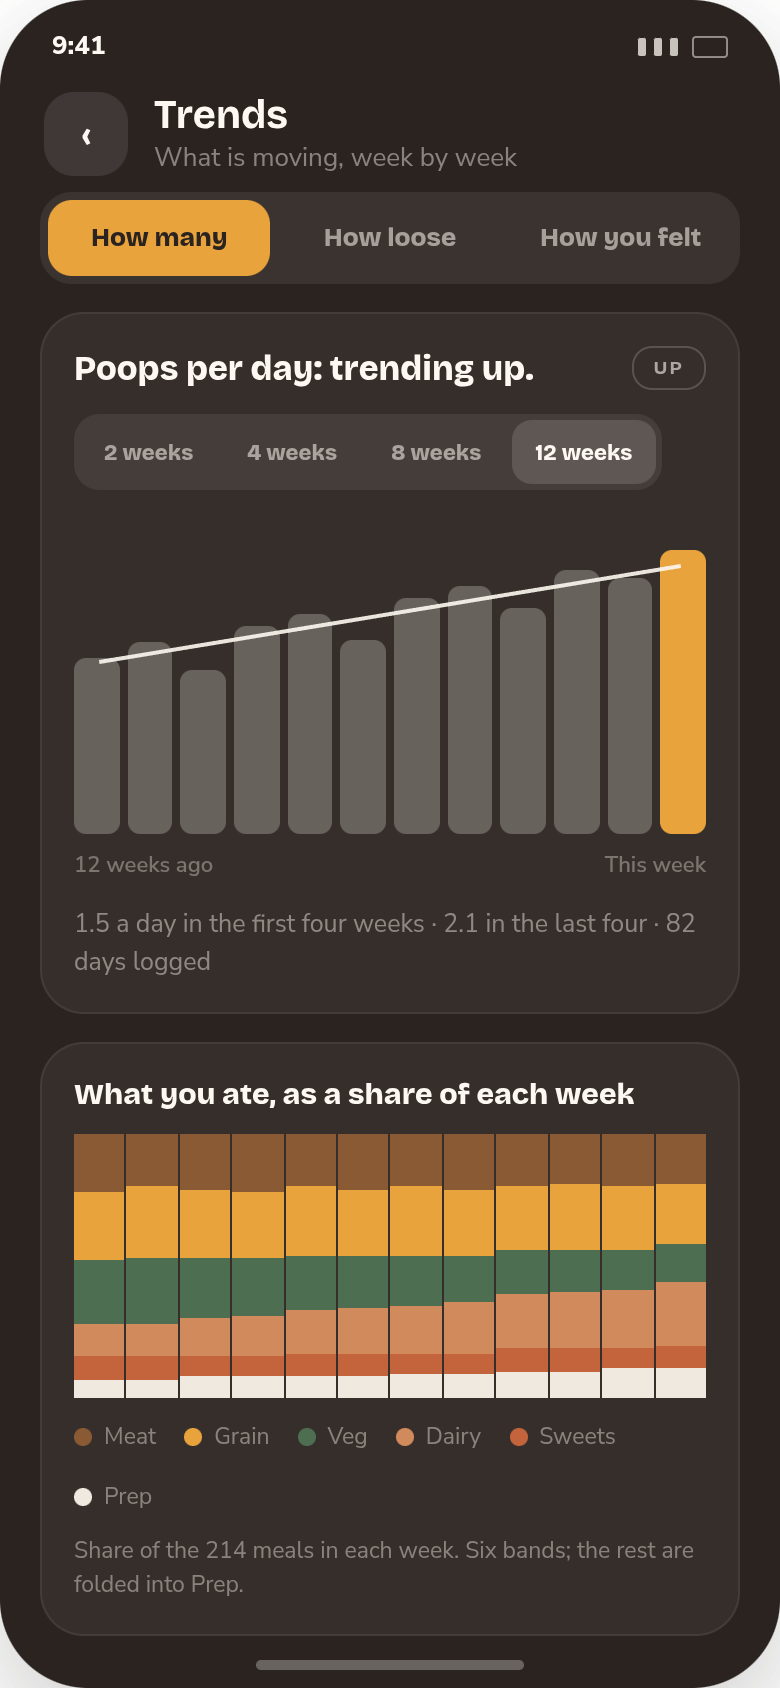
Trends screen: twelve weekly bars with a fitted line and an Up chip, and a stacked chart of what each week's meals were made of.
04

Experiments

Suspect red meat is the problem? Cut it for fourteen days and see what the numbers say after. Or change nothing and just watch the next fourteen days as they come.
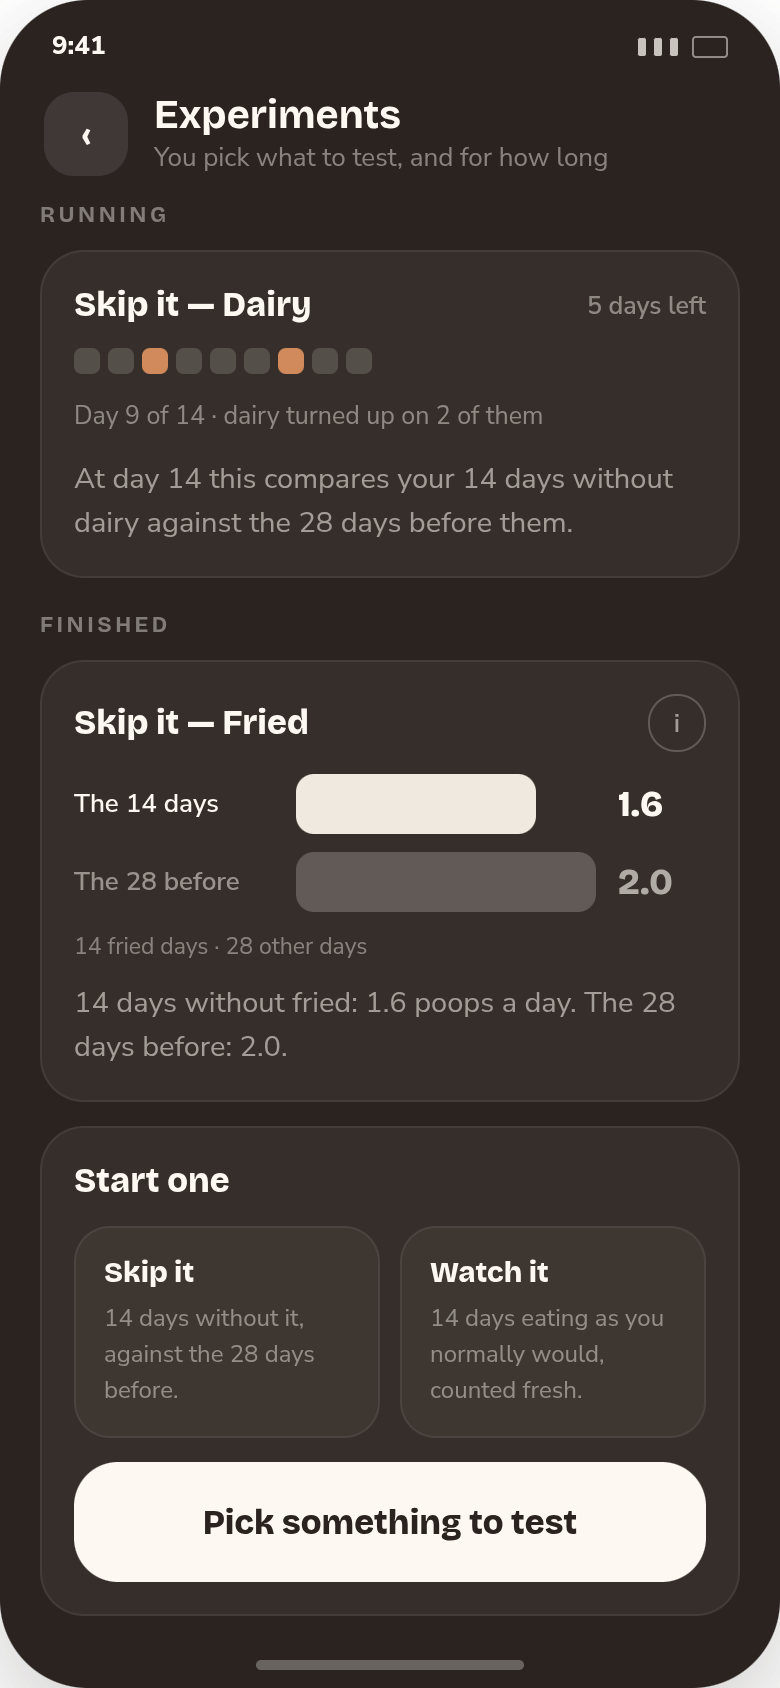
Experiments screen: a running fourteen-day skip on dairy with its day grid, a finished one on fried showing 1.6 a day against 2.0 before, and the two kinds you can start.

Looking back

What happened, and what it means.

History is the record: every meal and poop, at three zoom levels. Here is where you can really take a deep dive into the analysis of your diet and poops. The app uses math to identify patterns, and then shows you what it found.

History

Three zoom levels.

History · 1 of 3
Hours

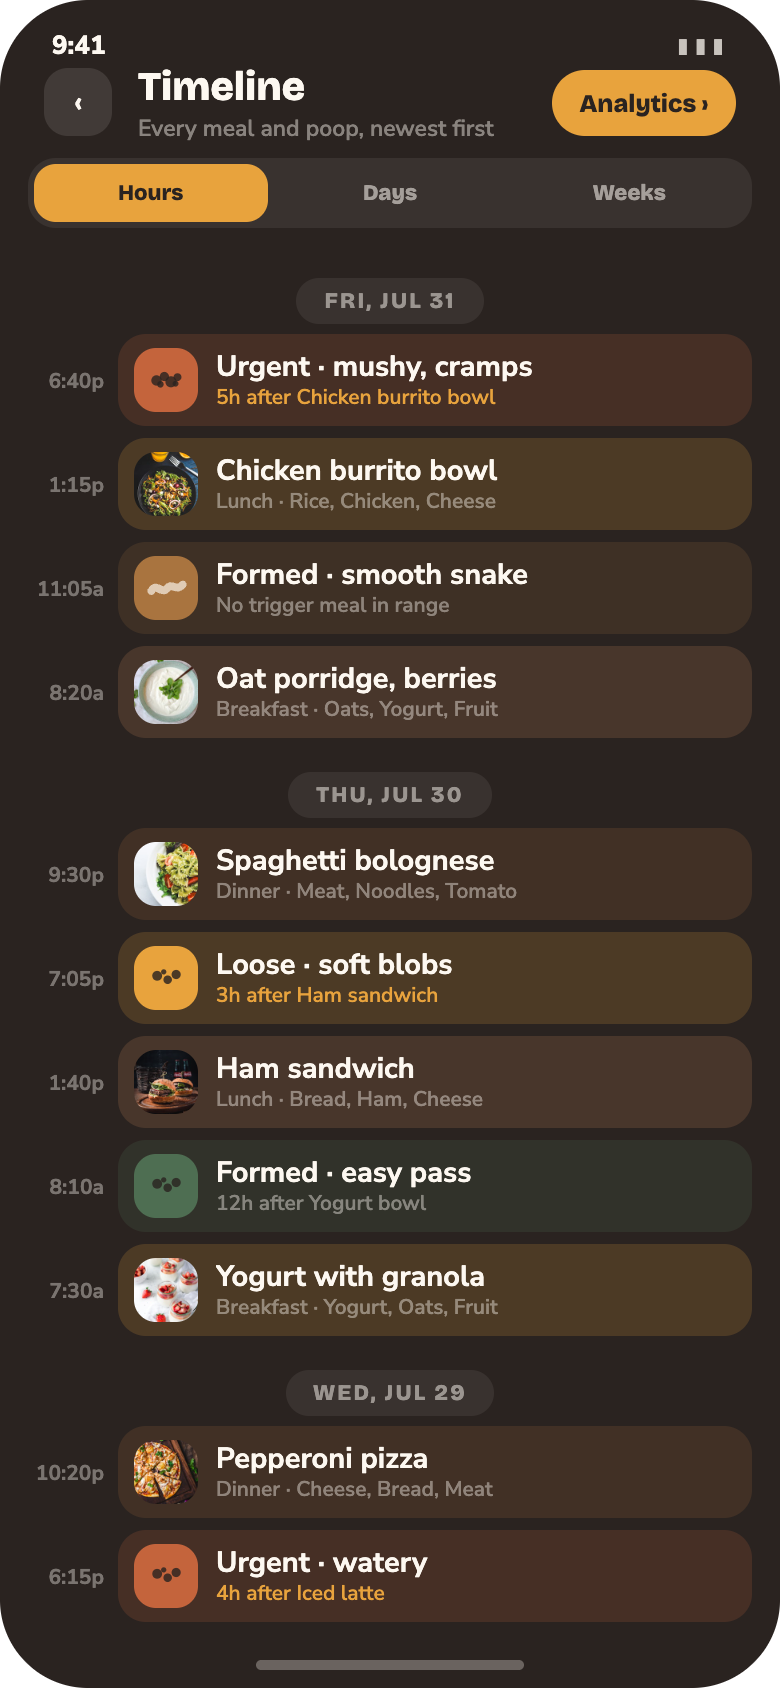
Everything you logged, newest first, and what each poop came after.

Timeline, Hours view: each meal and poop as a full-width bar with its time, name and what it followed.
History · 2 of 3
Days

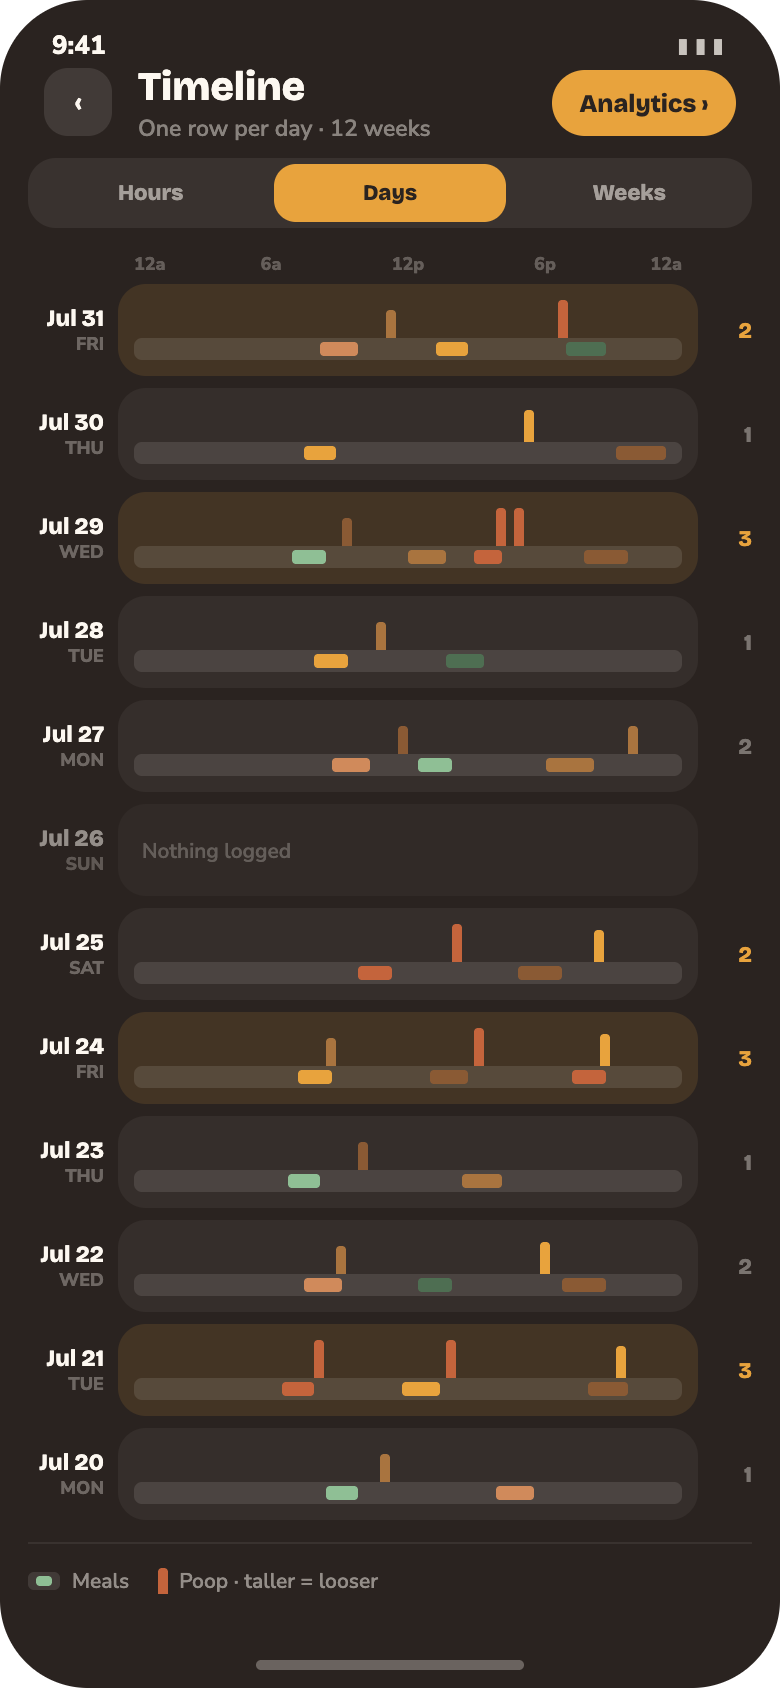
A day per row, so you can see a late dinner and what it did at 6 am.

Timeline, Days view: one 24-hour bar per day with meals along the bottom and poops standing on them.
History · 3 of 3
Weeks

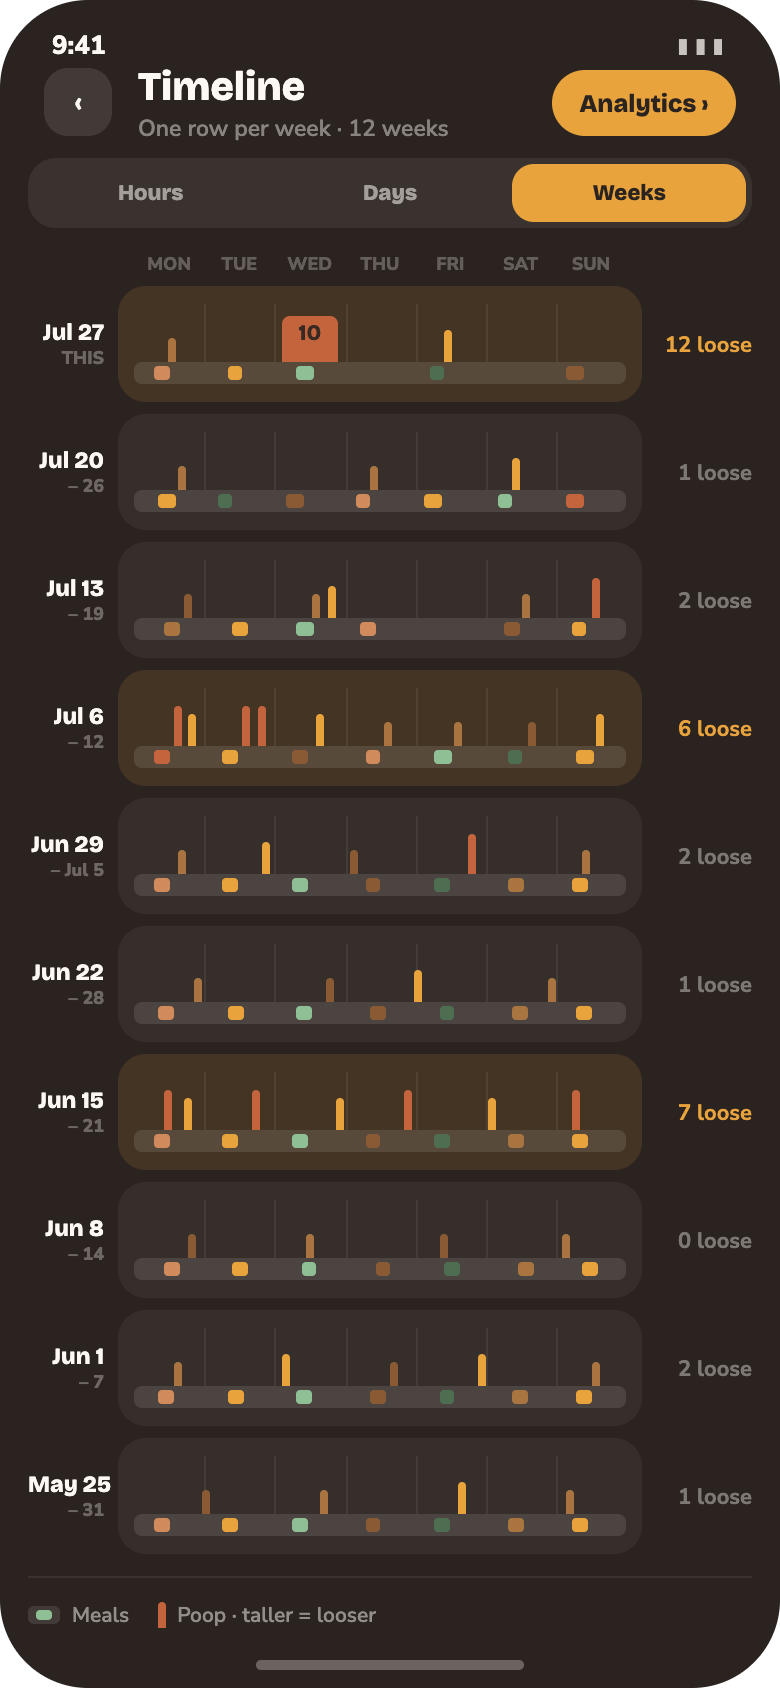
Twelve weeks at a glance. Bad stretches are impossible to miss.

Timeline, Weeks view: one bar per week across twelve weeks, with bad days standing out.
Analytics

Ten kinds of finding.

Analytics · 1 of 4
Patterns

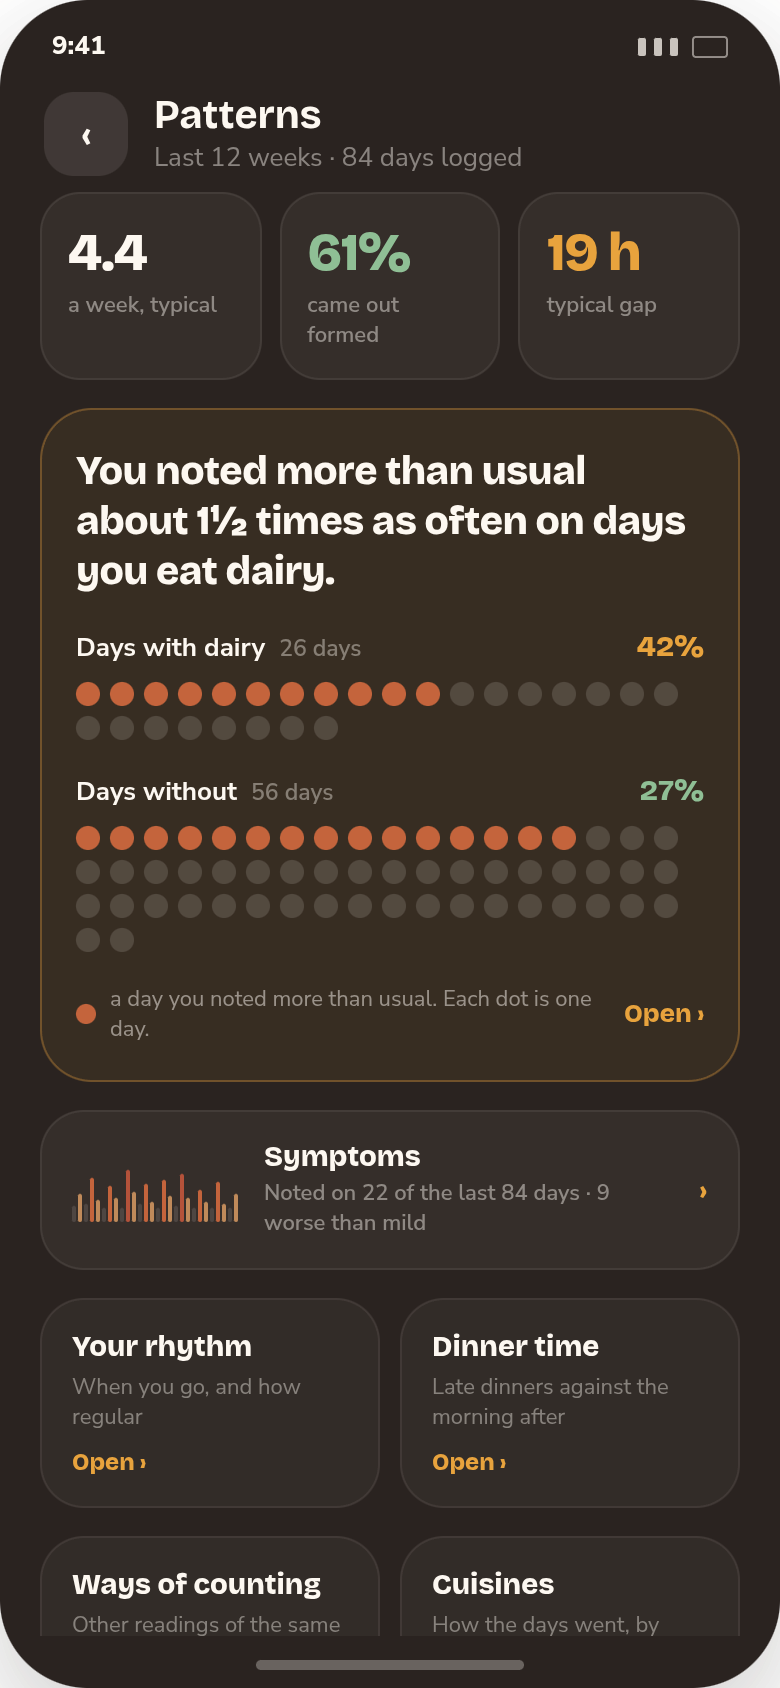
Everything the app has noticed, sorted by how sure it is.

Patterns screen: three summary figures, the strongest finding drawn as countable dots, a symptoms sparkline and the doors to the deeper screens.
Analytics · 2 of 4
A food, up close

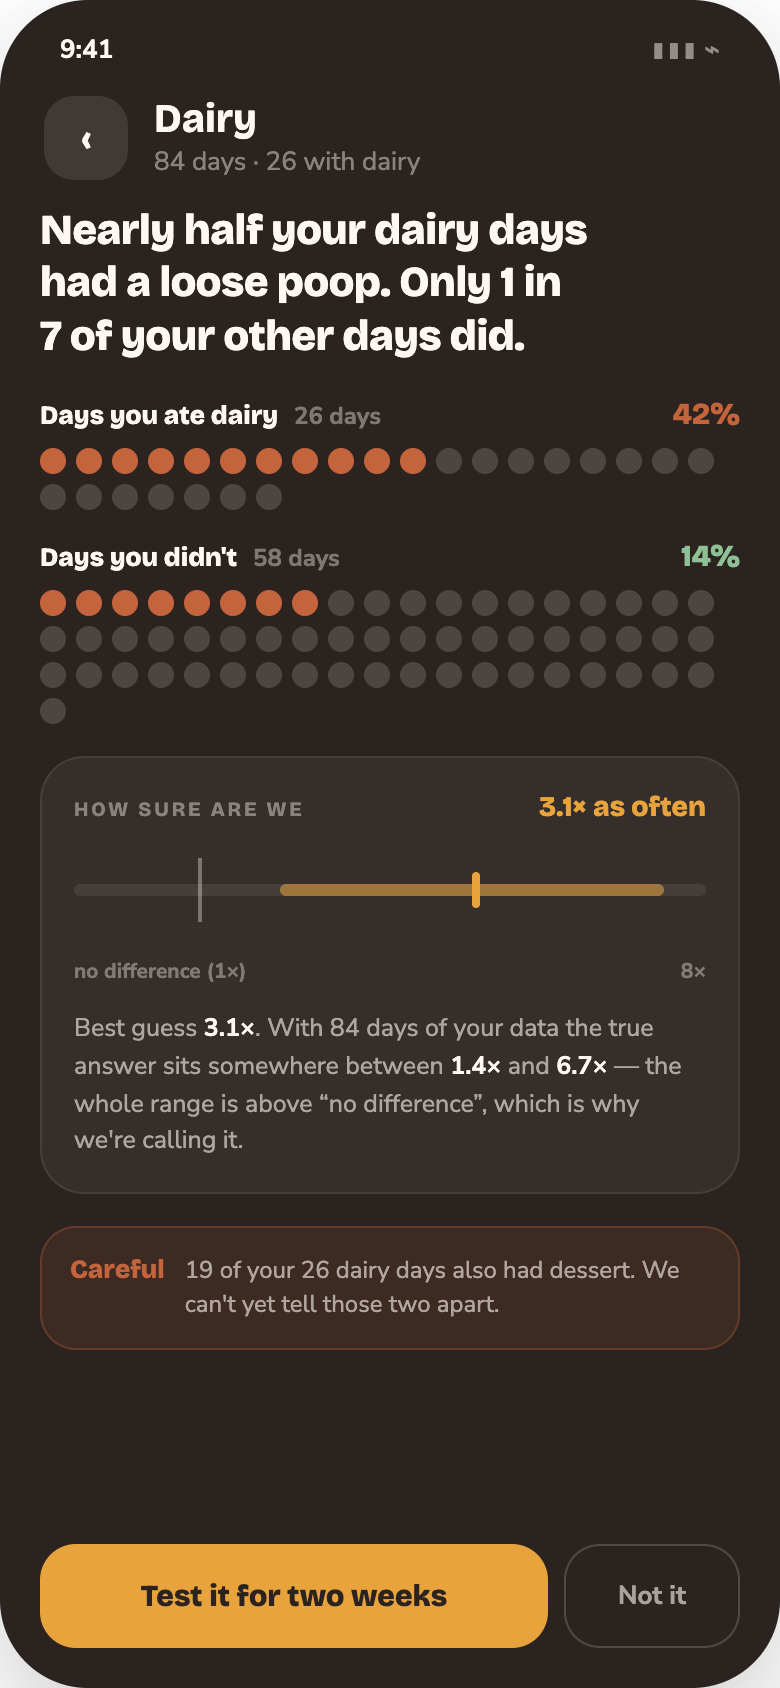
Every day as a dot you can count, and an honest range rather than a grade.

Dairy detail: days with dairy versus days without, drawn as countable dots, with a confidence range.
Analytics · 3 of 4
Your rhythm

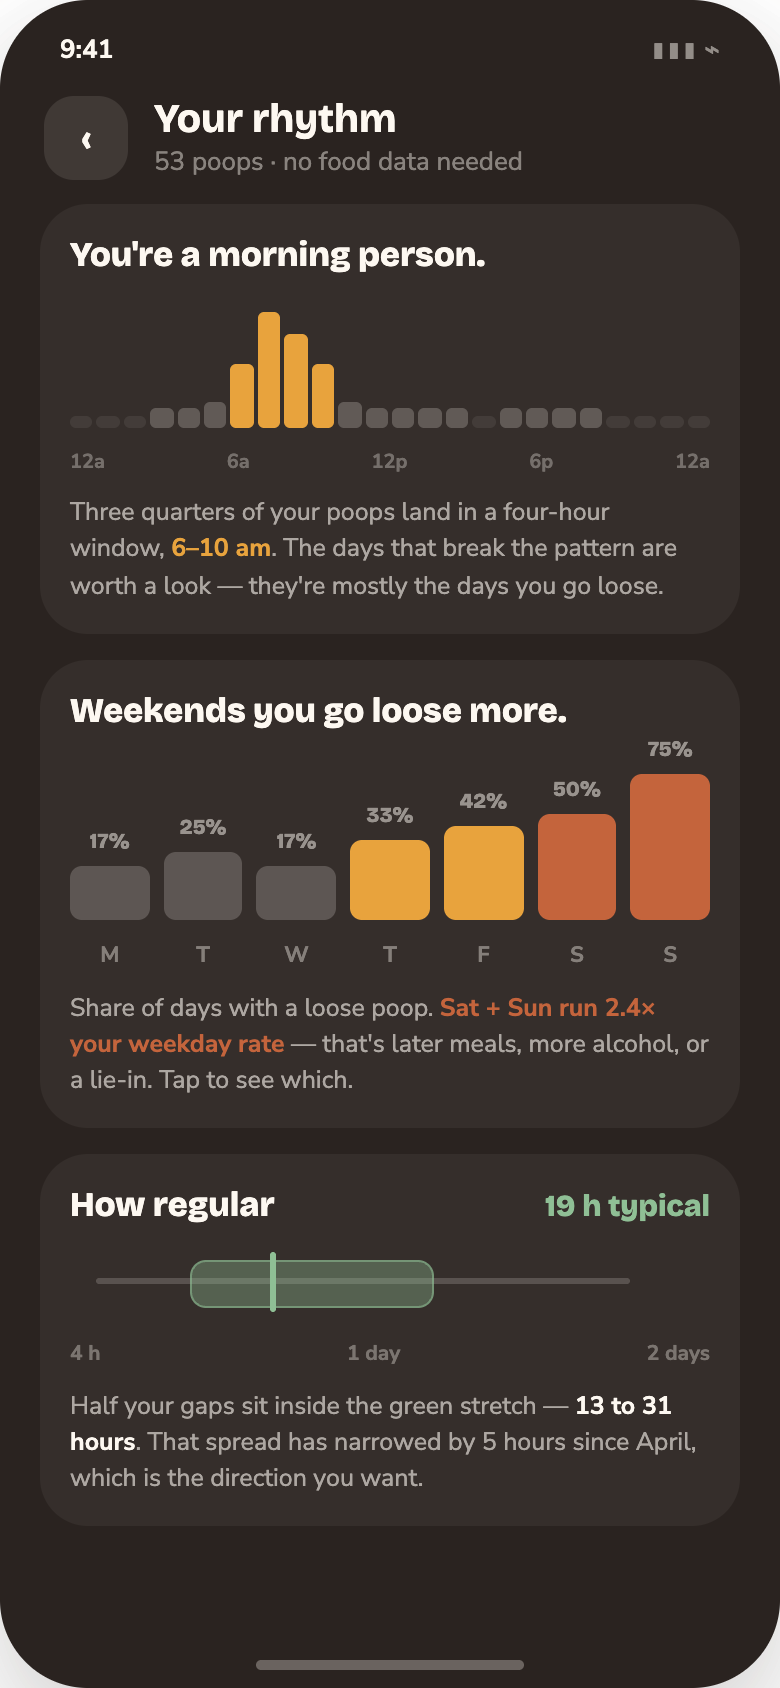
When you go, which days run worse, and how regular you are.

Rhythm screen: hour-of-day histogram, rough days by weekday, and the spread of gaps between poops.
Analytics · 4 of 4
Dinner time

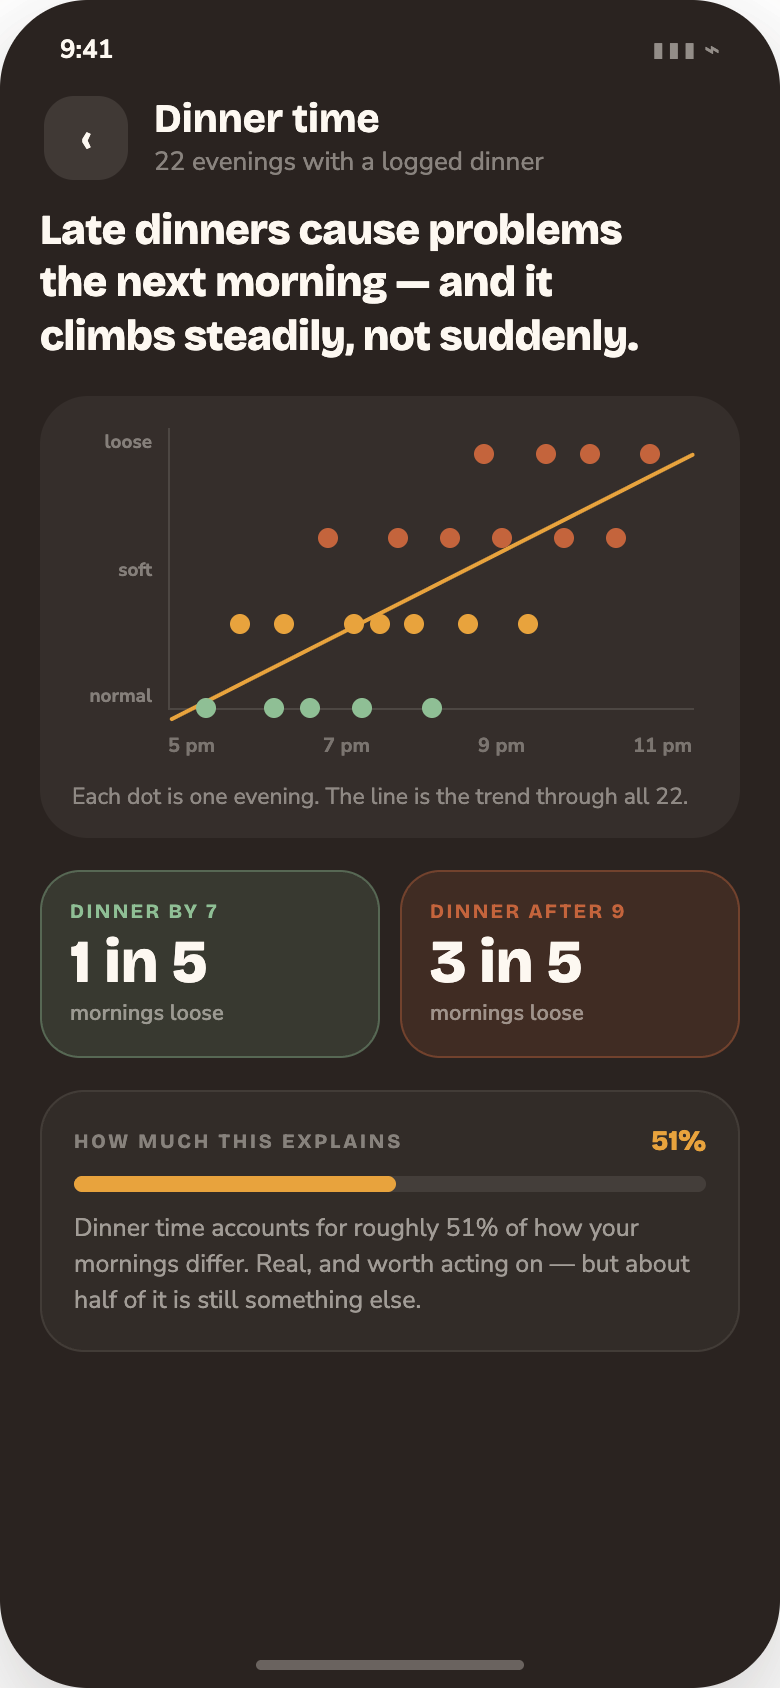
Late dinners plotted against the morning after, with a real trend line.

Dinner time screen: a scatter plot of dinner hour against next-morning outcome with a fitted line.

Neeeeew achievement!

A little credit for keeping at it.

A tracker only works if you keep using it. Achievements mark the milestones that make the data worth something: the first full week, the hundredth entry, the first real pattern. They are yours to collect, compare and share. More than a hundred to unlock at launch; these are eight of them.

First Entry
You logged the thing. Hardest one.
7
Full Week
Seven days without a gap.
Full Spectrum
Every type on the scale, logged once.
100
Century
One hundred entries in the book.
2.4×
First Suspect
Enough data to name a food.
12
The Long View
Twelve weeks of history behind you.
0.4×
Exonerated
Cleared a food you'd been blaming.
Boring Week
Seven days, nothing but normal. The goal.
Coming soon to the Google Play Store.

Android first, free to start, and quick enough to log that you'll actually keep it up.

Get it on Google Play
Coming soon
Launching 2026